Monday, June 13, 2016

KISSmetrics

(COURTESY: KISSmetrics)


Learning about KISSmetrics


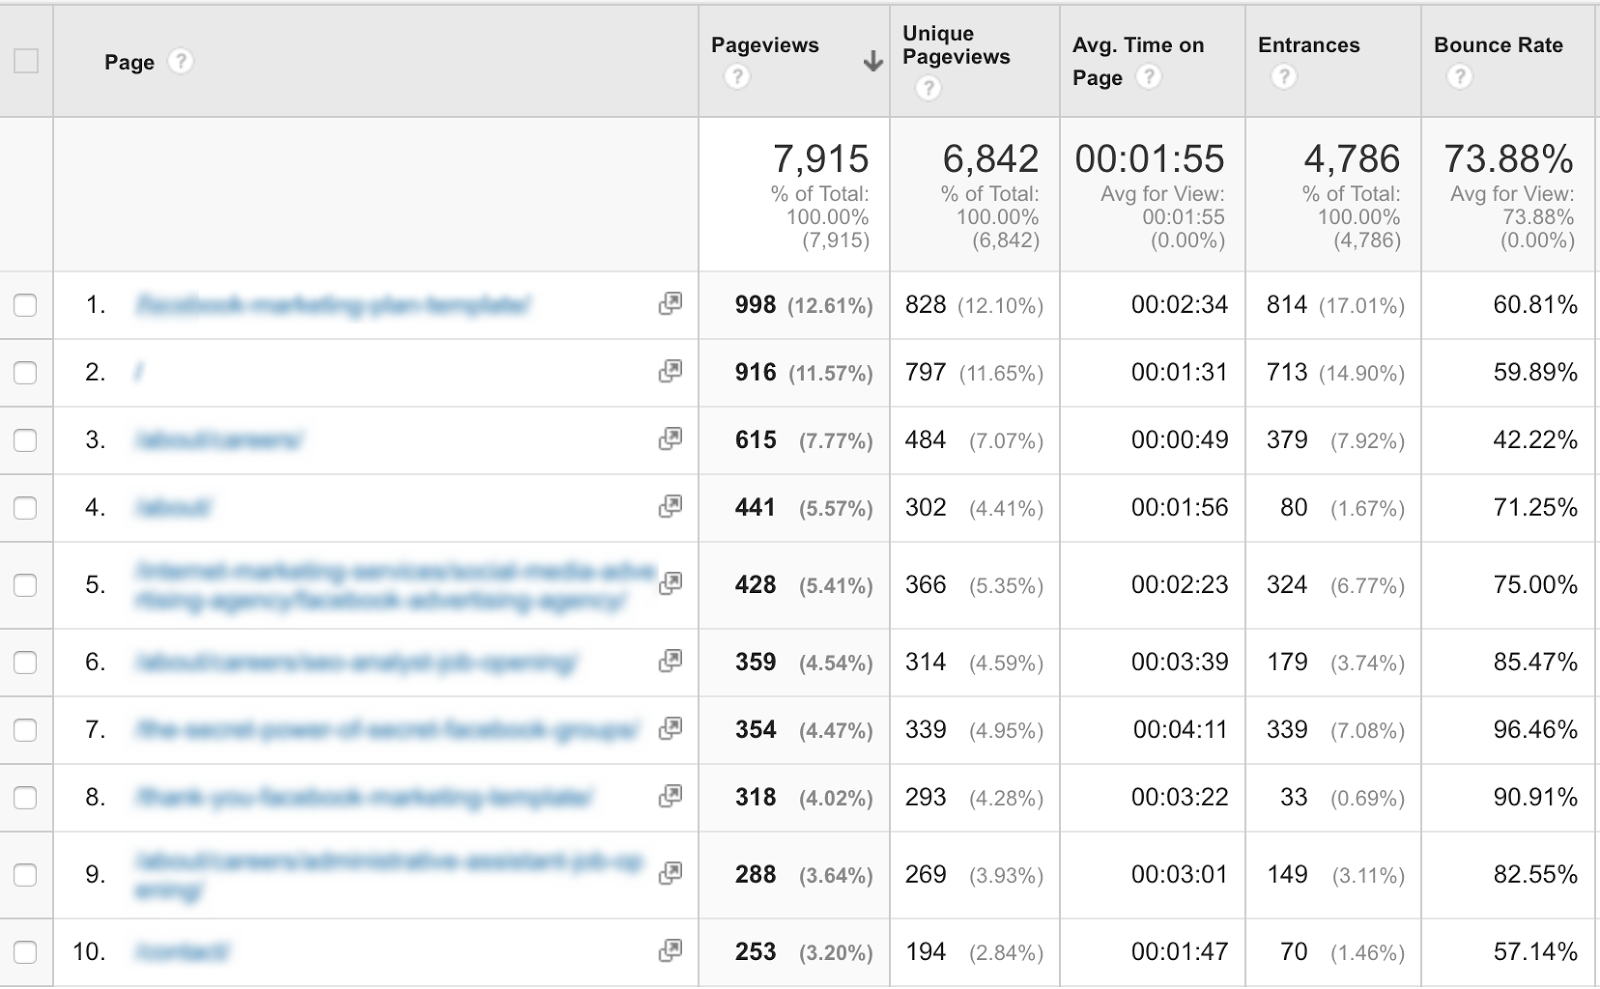
Web analytics provides information not only website traffic but as a tool for market research. Marketers can use the collected data to assess and improve a website and measure the effectiveness of advertising campaigns. Web analytics also are ideal for gauging traffic and trends of familiar elements, making it a useful market research tool.

Arguably the most known web analytics tool is Google Analytics, the service offered by the technology company Google that tracks and reports website traffic. As a freemium service, Google Analytics provides a free platform but also a fee-based platform for enterprise users called Google Analytics 360. An estimated 10 million to 25 million websites use Google Analytics, suggesting that roughly 50 percent of business websites use the tool (Garberson, para. 15).

When I was an affiliate marketing manager for a vegan manufacturing company, the company had a subscription with the web analytics company KISSmetrics. The San Francisco-based customer analytics platform that provides visualization tools on how users interact with their website, web applications and mobile products. The company started using the platform when KISSmetrics had a promotion where new users could test new experimental features and help decide whether they would become permanent parts of the product (Emerson, para. 2).

KISSmetrics allowed the company to track the movements of visitors throughout the website. KISSmetrics followed visitor patterns that allowed the marketing department to see visitors in a timeline view. We were able to see how customers made certain actions on the website, such as whether they signed up for an e-mail newsletter, purchased a new product or entered a discount promotional code. The platform allowed the marketers to track customers whether they accessed the website by the device. I found the data presentation to be visually intuitive, where each circle corresponded with how many times the customer took action:

(SOURCE: KISSmetrics)
In this diagram, the corresponding lines showed a step-by-step funnel how the customer went through a particular action. What I liked about the platform is that the data was easy to understand and useful in determining marketing actions. I also found the platform to be comprehensive because it tracked all customer interactions, regardless of the platform. 

 KISSmetrics has several features:
  • Funnel report: The conversion tool that tracks how people convert from prospects to customers. Our company also used conversion funnels to record actions such as filling out a form, watch a video or to print out an electronic coupon. More importantly, the report allowed the marketing department to identify where web traffic had a bottleneck where customers would stop on the website.

                                                                                                                                                               (SOURCE: KISSmetrics)
  • Cohort report: This report allows business to see how like-minded consumer groups behave over time for a customer interaction. For instance, the report does not focus on a particular transaction at a visit but how that particular group makes decisions for a prolonged period. The report shows groups change their consumer interaction as markets change. The reports allow marketers to group people by marketing channel to see which campaigns bring in the highest conversions.
(SOURCE: KISSmetrics)

  • Path report: This report shows which channels take to become a conversion. This report allows marketers track a visitor’s actions and the in-between activities or events that lead to a conversion. This report lets marketers know where to focus their efforts and resources. This report also reveals the best channels for acquiring leads and conversion; seeing how long viewers convert to making transactions; and analyzing the events that move a person toward an action.

(SOURCE: KISSmetrics)
  • A/B testing: Our marketing department used this report the most. We could test for any outcome, such as if the homepage headline impacted our newsletter signup lists. We regularly set up our testing for customer retention as a conversion action or event by seeing whether the choices for a new landing page or a Black Friday promotion made the right impression on customers. The A/B testing period must run a minimum of seven days to gauge metric effectiveness. KISSmetrics also allowed for integration with outside A/B test platforms, which KISSmetrics could interpret the views results.
                                                                                                                                                      (SOURCE: KISSmetrics)
  • Revenue Report: This report allowed the marketing department to determine which channels produced what revenue with a clear visual picture. We were able to see what segments were bringing in the most revenue, the highest lifetime value and the highest cost-per-click. The report allows marketers to determine churn rate by a period from a minimum 30-day period to a customized term of two years. As an e-commerce business, we set our customized time for a rolling six-month setting to see whether the results were consistent. The revenue report also can evaluate paying customer information, such as active customers, paying customers gained and paying customers lost.
                                                                                                                                                     (SOURCE: KISSmetrics)

                KISSmetrics vs. Google Analytics

KISSmetrics’ primary strength is that it identifies analytics down to the individual level. At the former company where I worked, we tagged each sales training graduate by a unique ID referral code. This capability made it preferable for use measure a variety of metrics, such as purchases, marketing campaign goals and channel funnels. Google Analytics can track people, but the limitation is that the visit and registration must take place in the same visiting session (“What is the difference between Google Analytics and KISSmetrics?” para. 15).

Google Analytics can provide insight into how visitors interact with a website. Google Analytics’ advantages are getting session data, viewing a general engagement and check referral data. Conversely, KISSmetrics’ strengths are showing how customers come to websites, track an acquisition funnel and documenting A/B testing. Conversely, KISSmetrics required a developer to integrate into our company’s website particularly when the company customized its features. KISSmetrics also needed some events to have separate javascript, which again called for a developer. Google Analytics’ free platform.

In summation, KISSmetrics is a web analytics platform that provides a unique perspective on tracking individual visitors. KISSmetrics can track which channels work best to bring in customers, when people leave the sales funnel and whether customers are successful at using the website. While it is natural to compare KISSmetrics with Google Analytics, both platforms can work together to provide detailed marketing data.

REFERENCES:

Emerson, R. (2012, March 19). “KISSmetrics looks to turn your customer data into an interactive infographic.” Tech Crunch. Retrieved June 15, 2016, from https://techcrunch.com/2012/03/19/kissmetrics-experiments/

Garberson, A. (2014, August 5). “20 Google facts & stats that every marketer should know.” Lunametrics. Retrieved June 15, 2016, from http://www.lunametrics.com/blog/2014/08/05/20-google-facts-stats-marketer/

“What is the difference between Google Analytics and KISSmetrics?” (n.d.) KISSmetrics. Retrieved June 15, 2016, from https://blog.kissmetrics.com/google-analytics-and-kissmetrics/

Tuesday, June 7, 2016

Developing a Social Media Marketing Strategy

(COURTESY: Top 10 Social Media)

The Social Network

Social media marketing has become more than a temporary fad. In today’s society, it has become an all-encompassing and unavoidable of most people’s lives. That logic also applies to the marketing industry. In an environment where every click, like, tweet, share, sign-up and view are now recorded documents, here are some statistics for marketers to consider:
  • More than 2.3 billion people are active social media users.
  • There are more an estimated 1.65 billion active mobile social media accounts, with the average person owning more than five social media accounts.
  • One million new, active mobile social media users increase an estimated 1 million per day.
  • Social networks earned an estimated $8.3 billion in revenue from advertising in 2015.
  • According to a survey, 38 percent of organizations plan to spend more than 20 percent of their 2016 advertising budgets on social media channels.
  • More than 30 percent of Fortune 500 companies have a presence on Twitter.
  • People age 55-64 are more than twice as likely to engage in branded content than people ages 28 and younger (Smith, para. 5-37).
Because of increasing global connectivity, the communications gap between companies and customers is reduced considerably. However, companies must consider the appropriate channels with which to engage customers and reaching new audiences.

“With so many social media platforms available to the marketer, should a company adopt only one platform as its main/primary channel?”

Knowing which social media platform can be tricky. Despite all the information and data on which platforms work well, the human element can be a variable. People follow trends, which can change quickly. So a company engaging in a social media platform must pay attention to trends while incorporating a consistent, but an adaptable social marketing strategy.

There are a few rules of thumb:
  • Understand that each social media platform has a different scope. Facebook is known as the more “social” for businesses where people can leave a message, browse through photos and talk to targeted potential customers. Twitter is suited for more immediate updates on company news. LinkedIn is becoming a resource for professional resources and leads. A photo-heavy company should consider Pinterest and Instagram.
  • Look at each social media channel to see which one will work best for the scope. Companies need to consider the product and services they are offering and the available human and financial resources at their disposal. Companies do not need to sign for every social media platform available; it is better to master one or two platforms than to have five average to unattended platforms.
  • Work out a clear plan on how to use the platforms. Companies need to decide on a consistent schedule for posting, who will be the account administrators, how to respond to complaints or criticism and editorial policy. The company also must make sure that it sticks with the plan because it takes time and investment over a sustained period to achieve efforts.
A company new to social media should start with one or two platforms that complement each other. The ultimate goal for a social media marketing strategy is to create an actionable audience that will create some business benefit over time. Social media merely opens the door for an audience; the ultimate goal is to develop an online community that can convert to advocates and customers.

“Do you think this week’s readings regarding content vs. conversation factor into the decision? Please feel free to use a real of fictitious company to explain your position.”

The shift in content conversations changed dramatically in the past 10 years, where the emergence of blogs and aggregate distributors allow the online discussion process to be multidimensional. As Kaushik points out, “Anyone can access the Web, and if they have something of value to say, they can reach a relevant audience (p. 245).”

The Forrester Research created the concept of the social technographics ladder, which is a categorization of the types of internet/social media user. Li and Bernoff explain that there different entry points for engagement, where customers can start the engagement process either slowly or immediately depending on their interests (p. 73).


By examining how each person fits on each rung on the ladder – and more importantly, how each person enters and leaves a social relationship – marketers can come up with which sorts of strategies make sense to reach customers.

When I was the affiliate marketing manager for a small vegan manufacturer and distribution in North Carolina, the company struggled to decide on using social media to promote its business. The company had a Facebook page managed by a part-time employee. We began an audit of our resources, our website and customer base through surveys to determine our social media direction.

Once we gathered the information, we asked the following questions:
  • Where is our audience? Our core customer was in the 45-54 age demographic, and we discovered 37 percent of our customers had at least one social media account. More than 80 percent of the customers who had at least one social media account had Facebook accounts. Of the Facebook account holders, 68 percent considered themselves followers (meaning they visited the page occasionally to read the latest post). When asked whether they would refer people to the company’s Facebook page, more than 70 percent said they would recommend people if possible (NOTE: The page at the time was a closed-group page).
  • How active is the audience? We found that roughly 62 percent of our customers with Facebook accounts were active (defined by our metrics as posting at least once per month). When we asked customers how often they came to our page, 32 percent said at least once per month. While the numbers seem to be low, at the time our company posted content once every four days. We saw the numbers as an opportunity to increase our following by concentrating more of active engagement and content from a full-time employee.
  • For what our customers are searching? In addition to socialization, our service found that 48 percent of our customers were searching for information. In a follow-up survey, the majority of our respondents (74 percent) said they would like more information on the company’s products and information they could share with people. Forty-three percent said they searched other company websites and social media pages to find information on healthy lifestyle products and information. Surprisingly, nearly half of the respondents stated that they would purchase products advertised on the Facebook page.
With our research, the company decided to beef up its Facebook page presence. The company hired a full-time employee to handle the social media page. We started posting content more frequently (three times per day – one post on a product, one post on nutritional information and the third post on lifestyle activities) and began posting ads where members could buy the products while on Facebook, using a trackable link. Using the Facebook page as a sales and conversion channel, we began to track our numbers to gauge our page’s effectiveness.

It is OK for a company to pick and choose which social networks to join. As a small business, the company may not be able to maintain a constant presence on multiple platforms. A company needs to assess each social media platform annually to ensure the pages are accomplishing their goals – building an active audience while converting visitors into customers.

REFERENCES:

Kaushik, A. (2010). “Web analytics 2.0: the art of online accountability & science of consumer centricity.” Indianapolis, IN: Wiley & Publishing, Inc.

Lee, C. & Bernoff, J. (2011). “Groundswell: Winning in a world transformed by social technologies.” Watertown, MA: Harvard Business Review Press.

Smith, K. (2016, March 7). “Marketing: 96 amazing social media statistics and facts for 2016.” Brandwatch. Retrieved June 6, 2016, from https://www.brandwatch.com/2016/03/96-amazing-social-media-statistics-and-facts-for-2016/

Monday, May 30, 2016

The Perfect Landing Page

(SOURCE: Reputation.com)

What Is a Landing Page?


In online marketing, a landing page is a single, standalone website page that appears in response to a viewer clicking on a search result or an advertisement. Also called “lead capture pages,” a landing page typically displays sales copy that seeks to capture a visitor’s information and is visually optimized to capture that information.

Landing pages often are linked with social media, email and search engine marketing campaigns to convert visitors into leads or sales. In lead generation efforts, the landing page will request the visitor submit contact information, usually a phone number and an email address, in an inquiry form. In sales campaigns, the landing page usually has a link that directs viewers to a shopping cart or checkout. The linked URL allows marketers to evaluate the campaign’s success by its click-through rates and conversion rate.

A common misnomer is that any website that has a form qualifies as a landing page. The definition of a landing page is that it exists solely for the purpose of capturing a visitor’s information. While a website’s home page or contact page may have a similar form, those pages exist beyond the function of capturing information.

What Makes a Landing Page Different?

(SOURCE: Wishpond)


Landing pages can serve two purposes – as a reference page and as a transactional page. The reference page presents information that is relevant to the visitor on which to make a decision. The transactional page uses persuasive copy and elements to prompt a visitor to make a purchase, which includes a form to fill out information. The visitor’s information becomes part of a mailing list with the intent of developing a customer relationship.

Though landing pages can vary because of audience, intent and product or service, Patel says there are several unifying elements that characterize successful landing pages:
  • An informative headline that captures the viewer’s attention.
  • A persuasive subhead.
  • A visually compelling element, such as a picture.
  • An explanation of the products or services.
  • A value proposition.
  • A logical flow of content.
  • A persuasive element that identifies a negative behavior.
  • A second persuasive element that provides a positive behavior.
  • Testimonials, if appropriate.
  • Methods of contact.
  • A guarantee.
  • A powerful call-to-action (para. 15-126).
The inbound marketing product specialist Hubspot cites that the typical landing page viewer tends to have a short attention span, so content needs to be clear and succinct (Hussain, para. 5). Also, landing pages should avoid visual clutter not to distract viewers. A one-second delay in page loading can result in 11 percent fewer page views, a 16 percent decrease in customer satisfaction and a 7 percent loss in conversions, according to the Aberdeen Group (Hussain, para. 9). 

The following landing pages effectively use those practices to create a brief, informative and visually appealing glimpse of their brands, leading to potentially higher conversions:


Measuring Effectiveness
When designing a landing page, marketers need to give clear messages immediately. A 2006 study from Carleton University showed that viewers leave a page within five seconds if they do not find the landing page to be engaging (“8 landing page design best practices,” para. 1).

Monitoring landing page effectiveness should occur at frequent intervals, typically monthly. Three important metrics are a call to action click-through rates; visitor-to-lead conversion rates; and lead-to-customer rates. If a company has multiple landing pages with each page having a separate call to action, companies can evaluate each page’s respective click-through rate and improve those pages with the lowest rates.

Marketers also can measure their landing page’s effectiveness by taking the cost of the landing pages and web traffic per source and dividing them by the number of conversions to calculate the cost per lead for each channel. By evaluating the landing pages with these metrics, marketers can tinker with the content and design to improve conversion rates to the optimal metrics. 

Landing pages are an effective way of reaching an audience with a highly targeted approach. A well-created landing page can reduce buyer hesitancy to try new products and services while gaining insight into the behavioral traits of existing customers by seeing to what they respond.


                                                                REFERENCES:

“8 landing page design best practices.” (n.d.) Wishpond. Retrieved May 30, 2016, from http://blog.wishpond.com/post/91777791230/8-landing-page-design-best-practices

Hussain, A. (2013, April 12). “7 key design tips for high-converting landing pages.” Hubspot. Retrieved May 30, 2016, from http://blog.hubspot.com/marketing/7-landing-page-design-tips#sm.000000h4r0vj5dveugm1jlqlknefw

Patel, N. (2014, October 7). “12 essentials of having a high converting landing page.” The Daily Egg. Retrieved May 30, 2016, from https://blog.crazyegg.com/2014/10/07/landing-page-essentials/


Sunday, May 29, 2016

Defining Bounce Rate

(SOURCE: DSA Global)

What Is a Bounce Rate?

Regarding web analytics, bounce rate can be one of the more misunderstood metrics in evaluating a website. Google Analytics define the term as “the percentage of single-page visits (or sessions) in which the person left your site from the entrance page without interacting with the page (para. 1).” The term occasionally is confused with exit rate, which is the percentage of website visitors who actively click away from a particular page to a different website after possibly visiting other pages.

A calculation of the web page’s bounce rate is:

             Total number of single visits on a page/Total number of entrances on the page

In web analytics, entrances are the number of times visitors entered a website through that page.

A common misconception is that bounce rate ties in with how much time a person spends on a page. Bounce rates pertain to how many total pages a person visits in one session, whether that person stays on a page for a few seconds or an extended time.

A bounce rate is a good tool to measure the quality of traffic to and the quality of content on a website’s entry page. A high bounce rate is a possible indication that visitors may not like the content and leave. Conversely, an entry page with a low bounce rate means the page causes visitors to view more pages and stay on the website.


(SOURCE: Zero Gravity Marketing)

What Is a Good Bounce Rate?

Defining a good bounce rate depends on the individual website’s purpose. For most businesses, the variable depends on the channel through which the company generates businesses. An e-commerce website wants low bounce rates because it increases the likelihood of sales. Conversely, a brick-and-mortar store that uses a website as an advertising tool to drive takeout orders may not object to a high bounce rate.

Looking at a website with multiple pages, the analytics page for bounce rate may look like this:

(SOURCE: Business to Marketing)

The ad marketing technology company Rocket Fuel estimates that a good bounce rate is within 26 percent to 40 percent (“What is a good bounce rate?” para. 6). Google Analytics benchmark averages for bounce rates are the following:
  • Content websites – 40 percent to 60 percent
  •  Lead generation sites – 30 percent to 50 percent
  • Blogs – 70 percent to 98 percent
  • Retail sites – 20 percent to 40 percent
  • Service sites – 10 percent to 30 percent
  • Landing pages – 70 percent to 90 percent

Also, Zero Gravity Marketing estimates that bounce rates tend to increase by 10 percent to 20 percent when viewers use smartphones and tablets because they tend to bounce around more (“What is a good bounce rate?” para. 9).

How to Reduce Bounce Rate

Several factors can trigger high bounce rates:

Single-page site: Google Analytics does not register multiple page views unless users reload the page. As a result, single-page websites tend to have high bounce rates.

Incorrect tracking code: Tracking page tags (a snippet of JavaScript code that the website owner adds to each page) run a visitor goes to a page, collecting visitor data and sends it to a data collection server. An incorrectly implemented code can misread information as a bounce rate.

Website design: A poorly designed entrance or landing page, poorly optimized images that do not correlate with content or take too long to load or poor navigation tools can lead to increased bounce rates.

User behavior: How viewers reach a page can affect bounce rates. For example, if a user bookmarks a website page, goes to the page and then leaves, that counts as a bounce.

Marketers can review specific pages and traffic sources to see if certain marketing activities influence bounce rate. Marketers also evaluate certain types of keywords to see if they have a higher bounce rate than other keywords, in addition to revisiting landing pages to see if they have issues (loading speed, extensive text, a lack of a call to action). Marketers also can add links to other pages and content on the website to give viewers a guideline on where to search for more helpful information.

The bounce rate can be one of the most useful analytics tools in evaluating a website. While there is no universal standard on what is an acceptable number, marketers can use the information to make the visitor experience useful by tweaking content to capitalize on each visit.

REFERENCES:

Aungst, P. (2016, May 8). “Google Analytics bounce rate explained.” Business 2 Community. Retrieved May 29, 2016, from http://www.business2community.com/online-marketing/google-analytics-bounce-rate-explained-01533069#im1aPzfw9YqQQzrA.97

“Bounce rate.” (n.d.) Google Analytics Help. Retrieved May 29, 2016, from https://support.google.com/analytics/answer/1009409?hl=en

“What is a good bounce rate?” (n.d.) Zero Gravity Marketing. Retrieved May 29, 2016, from http://zerogravitymarketing.com/good-bounce-rate/